Wednesday, October 11, 2006
Strength Of Competition Adjustments
In several sabermetrics and hockey posts I wrote over the summer that were looking at adjusted scoring from different eras using the normalization methods of the hockey outsider (Peter Albert) one consistent problem came up. That of adjusting statistics for the quality of opposition in the league.
This problem is clear when looking at the single season adjusted goal scoring leaders where nobody from the original six era makes the list and from looking at the career adjusted goal scoring leaders where the order of the top players depends on how we score seasons in the WHA. The problem of quality of opposition is highlighted by looking at inferior professional leagues like the WHA.
I was planning to look at several different potential methods that do not work. One could use the scoring rate, average age of players, standard deviation of player ages or the competitive balance in the league as proxies for quality of opposition. None of them work well.
In general, the scoring rate decreases when there is more talent in the league. The best players do not have as many weak opponents to score a lot of goals against. This is a simple reason why the NHL has had troubles keeping scoring up. That said, there are exceptions to the rule - most recently the increase in scoring in the league came from a raise in power play time. In fact, there are several examples over the years of rule changes affecting scoring rates. This observation that better hockey tends to be lower scoring on average does not hold up well during the 1980's when the Edmonton Oilers dominated the league.
When the average age of players is younger, in general the NHL is a better league. This is true in the recent past. When more older players are replaced by young ones the on average the overall talent level (and hence quality of opposition) increases. A lower quality league allows aging players to hang around longer. There are exceptions to this. In the early days of hockey, you didn't get paid too well as a player, so many still talented players left the league for higher paying careers keeping the average age down but decreasing the level of competition. Before the introduction of the entry draft (for example during wartime) really young players sometimes made the NHL, before they were good enough and this lowering of the average age reduces the quality of opposition. When pay went up in the mid 60's, even before expansion, the older players had better motivation to stay in shape and stay longer in the league and the average age increased without hurting the level of competition.
The standard deviation of ages more or less scales with the average age, because few players have made the NHL at really young ages. A few made it before age 18, but this is not possible anymore under the current CBA. It hasn't been possible for decades. Increasing the standard deviation of ages essentially means you have more old players and runs into similar problems as the mean age as measurement of quality of opposition.
Competitive balance is sometimes used as a proxy for quality of opposition, but it is imprecise as well. It is true that in the weakest years of the NHL, there were expansion teams who were really horrible. It is true that in the early years, there were often weak teams that were below the calibre of the rest of the league. However, we are now in the era of enforced parity. There are no more really good or bad teams. Does that make the quality of opposition any better? At best it is a shuffling of the opposition keeping it the same calibre. Having a bunch of .500 teams (assuming .500 means same number of wins as losses / it doesn't in the NHL) does not ensure a high quality of opposition.
So, I planned to throw my hands up and say that it is an unsolved problem. But then I got a comment from Pnep (Roman Nepomnyaschev) in the how do we value WHA years sabermetrically? thread. He suggests using the percentage of players in the league that had the best season of their career in a given season as a proxy for calibre of opposition. In a lower calibre year, more players will have their best year of their career than in a higher calibre year. This is a good idea. It assumes a few things. It assumes we have knowledge of the player's full career. For example, if we only use NHL stats when the league first formed many players had the best year of their career a few years earlier, but will be counted that year because we do not have proper stats for their career best season. If we tried to calculate this value too quickly, we run into the problem of players who hade their best year so far, but might have a better one in the future. For example, how can we say if 2005/06 will be the best year of Miikka Kiprusoff or Jonathan Cheechoo or Sidney Crosby's career. It is the best so far, but that doesn't mean that they won't beat it someday, however, its possible they never will. As a method to calculate how good a season a player had we will use the hall of fame monitor Pnep has produced.
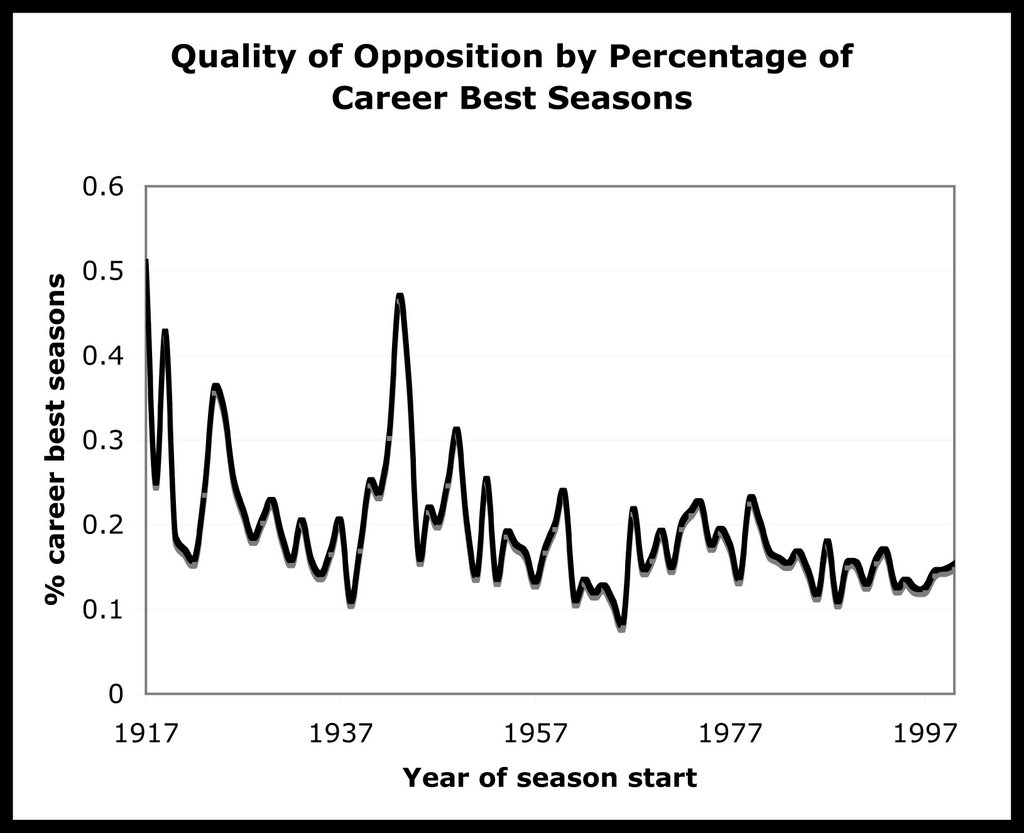
In graphical form here is the percentage of players who had the best year of their career by season in the NHL.

Here we see peaks during the beginning of the NHL - when there were player with unknown stats from leagues in previous years, then peaks during expansions, World War 2, a drop during the original six era and a rise during expansions and the WHA years with anther drop into more modern times. I think this is a relatively accurate showing of the calibre of opposition as a function of year in the NHL. It shows how tough it was during the original six heyday. It shows that it got worse during expansions and wartimes and it shows that the hockey today (a few years pre-lockout) had a very good calibre of opposition.
This problem is clear when looking at the single season adjusted goal scoring leaders where nobody from the original six era makes the list and from looking at the career adjusted goal scoring leaders where the order of the top players depends on how we score seasons in the WHA. The problem of quality of opposition is highlighted by looking at inferior professional leagues like the WHA.
I was planning to look at several different potential methods that do not work. One could use the scoring rate, average age of players, standard deviation of player ages or the competitive balance in the league as proxies for quality of opposition. None of them work well.
In general, the scoring rate decreases when there is more talent in the league. The best players do not have as many weak opponents to score a lot of goals against. This is a simple reason why the NHL has had troubles keeping scoring up. That said, there are exceptions to the rule - most recently the increase in scoring in the league came from a raise in power play time. In fact, there are several examples over the years of rule changes affecting scoring rates. This observation that better hockey tends to be lower scoring on average does not hold up well during the 1980's when the Edmonton Oilers dominated the league.
When the average age of players is younger, in general the NHL is a better league. This is true in the recent past. When more older players are replaced by young ones the on average the overall talent level (and hence quality of opposition) increases. A lower quality league allows aging players to hang around longer. There are exceptions to this. In the early days of hockey, you didn't get paid too well as a player, so many still talented players left the league for higher paying careers keeping the average age down but decreasing the level of competition. Before the introduction of the entry draft (for example during wartime) really young players sometimes made the NHL, before they were good enough and this lowering of the average age reduces the quality of opposition. When pay went up in the mid 60's, even before expansion, the older players had better motivation to stay in shape and stay longer in the league and the average age increased without hurting the level of competition.
The standard deviation of ages more or less scales with the average age, because few players have made the NHL at really young ages. A few made it before age 18, but this is not possible anymore under the current CBA. It hasn't been possible for decades. Increasing the standard deviation of ages essentially means you have more old players and runs into similar problems as the mean age as measurement of quality of opposition.
Competitive balance is sometimes used as a proxy for quality of opposition, but it is imprecise as well. It is true that in the weakest years of the NHL, there were expansion teams who were really horrible. It is true that in the early years, there were often weak teams that were below the calibre of the rest of the league. However, we are now in the era of enforced parity. There are no more really good or bad teams. Does that make the quality of opposition any better? At best it is a shuffling of the opposition keeping it the same calibre. Having a bunch of .500 teams (assuming .500 means same number of wins as losses / it doesn't in the NHL) does not ensure a high quality of opposition.
So, I planned to throw my hands up and say that it is an unsolved problem. But then I got a comment from Pnep (Roman Nepomnyaschev) in the how do we value WHA years sabermetrically? thread. He suggests using the percentage of players in the league that had the best season of their career in a given season as a proxy for calibre of opposition. In a lower calibre year, more players will have their best year of their career than in a higher calibre year. This is a good idea. It assumes a few things. It assumes we have knowledge of the player's full career. For example, if we only use NHL stats when the league first formed many players had the best year of their career a few years earlier, but will be counted that year because we do not have proper stats for their career best season. If we tried to calculate this value too quickly, we run into the problem of players who hade their best year so far, but might have a better one in the future. For example, how can we say if 2005/06 will be the best year of Miikka Kiprusoff or Jonathan Cheechoo or Sidney Crosby's career. It is the best so far, but that doesn't mean that they won't beat it someday, however, its possible they never will. As a method to calculate how good a season a player had we will use the hall of fame monitor Pnep has produced.
In graphical form here is the percentage of players who had the best year of their career by season in the NHL.
Here we see peaks during the beginning of the NHL - when there were player with unknown stats from leagues in previous years, then peaks during expansions, World War 2, a drop during the original six era and a rise during expansions and the WHA years with anther drop into more modern times. I think this is a relatively accurate showing of the calibre of opposition as a function of year in the NHL. It shows how tough it was during the original six heyday. It shows that it got worse during expansions and wartimes and it shows that the hockey today (a few years pre-lockout) had a very good calibre of opposition.
Comments:
<< Home
This is kind of off topic, Greg, because I'm only a little bit interested in learning about the relationship between scoring and parity. Two of your points relate to this relationship:
In general, the scoring rate decreases when there is more talent in the league. The best players do not have as many weak opponents to score a lot of goals against. This is a simple reason why the NHL has had troubles keeping scoring up.
I don't like this argument. As you note the 80's provide a powerful counter argument. The talent level in the NHL zoomed with the collapse of the WHA and the European invasion. Scoring zoomed, too.
Competitive balance is sometimes used as a proxy for quality of opposition, but it is imprecise as well. It is true that in the weakest years of the NHL, there were expansion teams who were really horrible. It is true that in the early years, there were often weak teams that were below the calibre of the rest of the league.
You are absolutely right about the key distinction here. This has nothing to do with the level of talent and everything to do with the distribution of the talent.
I don't think the overall level of talent makes much difference to the scoring rates. I think the distribution of talent makes a very large difference. The more parity, the less scoring.
I don't think that helps you on this particular quest but it seems to me that if this is so, it should be provable. Can you send me an email, Greg?
# posted by  : October 12, 2006 12:42 AM
: October 12, 2006 12:42 AM
Fashion Games of Teen Girls Interested Are Fun These challenges are at times shared amongst buddies.
This was zero cost because the students went to local stores and asked for either donations and gift cards
to purchase these items. You Divide everyone at the party into two groups, or tribes.
Also visit my homepage blue cross blue shield
This was zero cost because the students went to local stores and asked for either donations and gift cards
to purchase these items. You Divide everyone at the party into two groups, or tribes.
Also visit my homepage blue cross blue shield
# posted by : April 17, 2013 6:54 PM
: April 17, 2013 6:54 PM
nike air max, north face, true religion jeans, longchamp pas cher, ralph lauren pas cher, mulberry, vans pas cher, hollister, michael kors, timberland, sac longchamp, michael kors, oakley pas cher, hermes, air max, ray ban pas cher, coach factory outlet, hogan, burberry, ralph lauren uk, true religion jeans, air jordan pas cher, michael kors, abercrombie and fitch, nike roshe, lacoste pas cher, north face, air force, tn pas cher, nike air max, nike air max, nike blazer, kate spade handbags, louboutin pas cher, nike free run uk, coach purses, michael kors, lululemon, nike roshe run, converse pas cher, coach outlet, hollister pas cher, true religion jeans, new balance pas cher, coach outlet, vanessa bruno, true religion outlet, ray ban uk, sac guess, nike free

timberland boots, insanity workout, beats by dre, p90x workout, ghd, converse, louboutin, baseball bats, nike trainers, north face outlet, asics running shoes, lululemon, celine handbags, jimmy choo shoes, soccer jerseys, mont blanc, oakley, north face outlet, vans, soccer shoes, nike huarache, giuseppe zanotti, chi flat iron, mcm handbags, nfl jerseys, herve leger, ralph lauren, longchamp, babyliss, valentino shoes, hollister, nike air max, mac cosmetics, abercrombie and fitch, vans shoes, bottega veneta, reebok shoes, iphone 6 cases, hollister, hollister, nike roshe, gucci, new balance, wedding dresses, ray ban, ferragamo shoes, birkin bag, instyler, nike air max, converse outlet
toms shoes, ugg boots uk, moncler, supra shoes, pandora jewelry, swarovski, doudoune canada goose, bottes ugg, karen millen, coach outlet, barbour jackets, moncler outlet, juicy couture outlet, canada goose, louis vuitton, marc jacobs, moncler, doke gabbana outlet, canada goose outlet, pandora charms, michael kors outlet online, louis vuitton, juicy couture outlet, barbour, canada goose, canada goose outlet, ugg pas cher, canada goose, lancel, wedding dresses, hollister, louis vuitton, links of london, moncler, thomas sabo, moncler, moncler, sac louis vuitton pas cher, canada goose uk, moncler, louis vuitton, michael kors handbags, canada goose, ugg,ugg australia,ugg italia, replica watches, pandora charms, michael kors outlet, swarovski crystal, pandora jewelry, ugg,uggs,uggs canada, montre pas cher, moncler
Post a Comment
<< Home
![]()