Saturday, October 21, 2006
Does Parity Correlate With Scoring Rate?
In my sabermetrics and hockey post on strength of competition adjustments when comparing scoring from different eras, there was an interesting comment by Tom Benjamin. He says:
I don't think the overall level of talent makes much difference to the scoring rates. I think the distribution of talent makes a very large difference. The more parity, the less scoring.
I don't think that helps you on this particular quest but it seems to me that if this is so, it should be provable.
So I set out to prove or disprove this theory.
By parity I will use the standard deviation of wins among the teams in the NHL that season. The higher the parity, the lower the standard deviation of wins. Since the length of NHL seasons has changed significantly over the years it is necessary to adjust this number for the schedule length. In fact, I am using the numbers that Pnep (Roman Nepomnyaschev offered in the comments in the Why We Need A Quality of Opposition Adjustment To Rank All Time Goal Scoring Seasons thread.
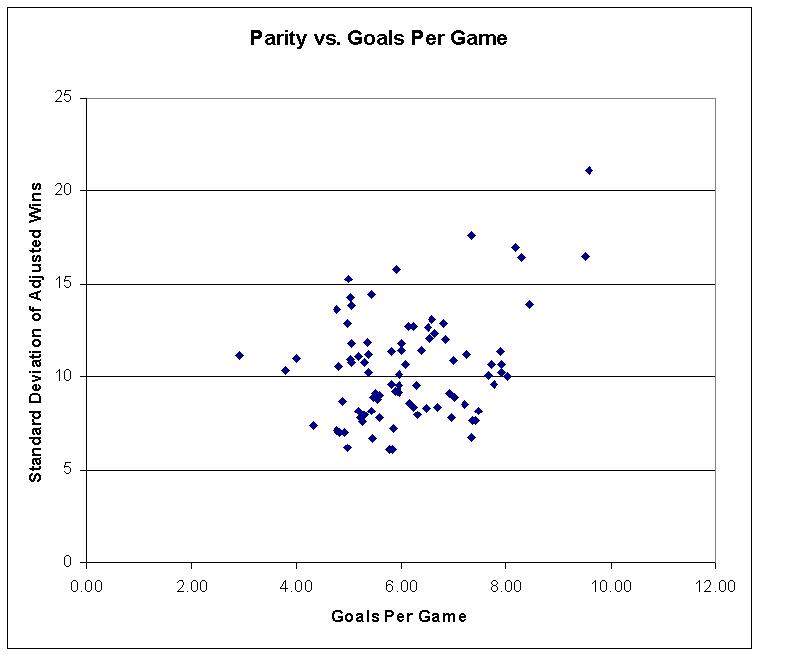
I plotted this parity value in each season against the goals per game in the same season. Here is the plot:

We can calculate the correlation between the parity and the goals per game. If they fit perfectly on a line with increasing slope (as this parity value increases so too does goals per game) we will get a value of one. If they fit perfectly on a line with decreasing slope (as this parity value decreases, goals per games goes up)we will get a value of -1. If there is no dependence of this partiy value with goals per game, we will get a value of zero. The correlation in this case is 0.33. So it would appear that as parity is decreased (standard deviation of adjusted wins increases in this case) then goals per game go up. This is consistent with Tom Benjamin's prediction.
However, there is an important statement often made in statistics. Correlation does not equal causation. This is an example of why this important disclaimer is often given. If we look at the plot, the increasing slope of parity vs. goals per game is almost completely determined by five points. These are the five points in the upper right of the graph. These are points with both a high standard deviation of adjusted wins and a high goals per game. Lets look further at these points. They come from the 1917/18, 1918/19, 1919/20, 1943/44 and 1944/45 seasons. These are the first three seasons in NHL history and the two seasons where the NHL talent pool was greatly depleted because of World War II. These are probably the seasons where the quality of play was the lowest. This correlation seems to be entirely driven by these five seasons. What happens if we remove them and repeat this calculation?
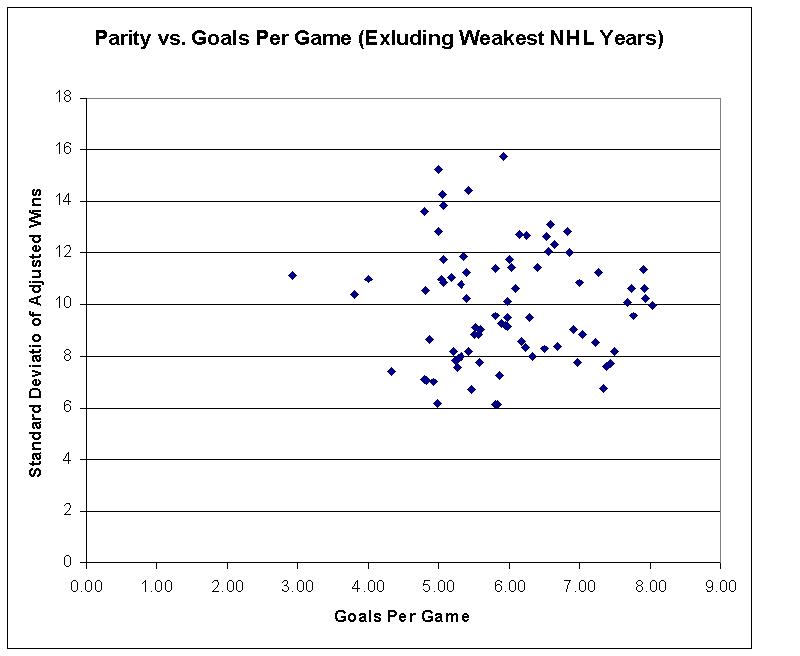
Here is the plot of the parity statistic against goals per game:

Now the correlation between the parity statistic and goals per game is gone. In fact the correlation is calculated to be -0.03. Effectively there is no correlation.
There is an apparent correlation between parity and scoring rates in the NHL if we plot all of the seasons the NHL has existed. That correlation is entirely driven by the five seasons where the NHL was weakest (its first three years and the two years at the end of World War 2). This is because scoring rates do correlate with the quality of play in the NHL. When there is a low quality of play scoring goes up. It happens that when there was this low quality of play there also was very low parity and that creates an apparent correlation. When we remove these seasons. we see no correlation.
This means that the decrease in scoring over the last decade or so in the NHL is NOT driven by an increase in parity in the NHL. However, it is likely driven (at least in part) by the increase in the level of talent in the NHL.
I don't think the overall level of talent makes much difference to the scoring rates. I think the distribution of talent makes a very large difference. The more parity, the less scoring.
I don't think that helps you on this particular quest but it seems to me that if this is so, it should be provable.
So I set out to prove or disprove this theory.
By parity I will use the standard deviation of wins among the teams in the NHL that season. The higher the parity, the lower the standard deviation of wins. Since the length of NHL seasons has changed significantly over the years it is necessary to adjust this number for the schedule length. In fact, I am using the numbers that Pnep (Roman Nepomnyaschev offered in the comments in the Why We Need A Quality of Opposition Adjustment To Rank All Time Goal Scoring Seasons thread.
I plotted this parity value in each season against the goals per game in the same season. Here is the plot:
We can calculate the correlation between the parity and the goals per game. If they fit perfectly on a line with increasing slope (as this parity value increases so too does goals per game) we will get a value of one. If they fit perfectly on a line with decreasing slope (as this parity value decreases, goals per games goes up)we will get a value of -1. If there is no dependence of this partiy value with goals per game, we will get a value of zero. The correlation in this case is 0.33. So it would appear that as parity is decreased (standard deviation of adjusted wins increases in this case) then goals per game go up. This is consistent with Tom Benjamin's prediction.
However, there is an important statement often made in statistics. Correlation does not equal causation. This is an example of why this important disclaimer is often given. If we look at the plot, the increasing slope of parity vs. goals per game is almost completely determined by five points. These are the five points in the upper right of the graph. These are points with both a high standard deviation of adjusted wins and a high goals per game. Lets look further at these points. They come from the 1917/18, 1918/19, 1919/20, 1943/44 and 1944/45 seasons. These are the first three seasons in NHL history and the two seasons where the NHL talent pool was greatly depleted because of World War II. These are probably the seasons where the quality of play was the lowest. This correlation seems to be entirely driven by these five seasons. What happens if we remove them and repeat this calculation?
Here is the plot of the parity statistic against goals per game:
Now the correlation between the parity statistic and goals per game is gone. In fact the correlation is calculated to be -0.03. Effectively there is no correlation.
There is an apparent correlation between parity and scoring rates in the NHL if we plot all of the seasons the NHL has existed. That correlation is entirely driven by the five seasons where the NHL was weakest (its first three years and the two years at the end of World War 2). This is because scoring rates do correlate with the quality of play in the NHL. When there is a low quality of play scoring goes up. It happens that when there was this low quality of play there also was very low parity and that creates an apparent correlation. When we remove these seasons. we see no correlation.
This means that the decrease in scoring over the last decade or so in the NHL is NOT driven by an increase in parity in the NHL. However, it is likely driven (at least in part) by the increase in the level of talent in the NHL.
Comments:
<< Home
I'm sorry I did not get back to you on your email. I think this is very interesting, but you did your study in a very complicated way. I don't like the way you are measuring parity.
Why not use a really simple study and instead of using all of hockey history, merely go back to the point we invented two conferences.
1) We can determine which conference had the most talent by comparing East to West records in the head to head games.
Does the better conference have consistently lower scoring in the games within the conference?
Which was the better conference over the entire period? Which was the higher scoring conference over the entire period?
2) Use standard deviation of points won within the conference to determine whether there was more parity in the East or the West in a given year.
Does the conference with the most parity have higher or lower scoring in the games within the conference? Does the conference with the most parity over the entire period have more or less scoring?
I'm not really into the statistical studies much any more, but I think those who are into hockey sabremetrics can learn a lot by comparing what are essentially two different leagues playing at the same time. As a result you don't have to worry about things like a different length schedule or different rules for overtime or different point schedules.
# posted by  : October 21, 2006 2:09 PM
: October 21, 2006 2:09 PM
The problem with your proposed study is it has travel disparities built into it. The west has much more travel then the east does. That will likely complicate things.
Why throw out the first 50 years of the NHL when it can be included in a much more comprehensive study that includes them and the more recent times? Unless you have some reason to believe that parity has changed since 1967..
Why throw out the first 50 years of the NHL when it can be included in a much more comprehensive study that includes them and the more recent times? Unless you have some reason to believe that parity has changed since 1967..

The problem with your proposed study is it has travel disparities built into it. The west has much more travel then the east does. That will likely complicate things.
True, but only in determining the better conference. If it is close, the West is better.
Why throw out the first 50 years of the NHL when it can be included in a much more comprehensive study that includes them and the more recent times? Unless you have some reason to believe that parity has changed since 1967.
If you want to use the whole league, I think you have to measure parity by percentage of points won. The problem with using wins is that the number is influenced by the number of goals. The more scoring, the fewer ties.
1967? I think that's going back too far isn't it? I don't think there was really an East vs West then was there? But that's another way to look at it.
We know the six new teams introduced in 1968 were in a clearly inferior league. Ignoring the crossover games was there more scoring among the original six or in the unoriginal six?
# posted by : October 21, 2006 2:56 PM
: October 21, 2006 2:56 PM
If you want to use the whole league, I think you have to measure parity by percentage of points won. The problem with using wins is that the number is influenced by the number of goals. The more scoring, the fewer ties.
If there is a problem where low scoring means more ties and hence less wins, then we have an artifical reason that it would appear that low scoring implies parity. If there are less wins in the league there are less adjusted wins and the standard deviation will have a smaller value. That did not show up in the study. There is no correlation (neglecting the 5 years that were throw out). This correlation does not exist.
I thought adjusted wins were a way around the overtime loss points - since they don't impact any wins totals. We still have continuity problems with the shootout year and the years when there was no vertime (versus those with overtime).
I conclude that there is no correlation between parity and scoring rates and I don't think any of these minor concerns would change that conclusion.
But you also have a problem on the other side of the equation. You're not isolating the factors we want to study on either side of the equation. There are many factors that have made goals go up or down over history. We want to isolate one factor: parity. (Or we want to isolate a second factor: quality
of the league.)
I agree with your conclusion from this data (even though it surprises me) but I have doubts about the methodology (including the whole idea about correlation. A lack of correlation does not demonstrate there is no link either. A single team can have an enormous impact on the STD but no single team can have the same impact on GPG.)
I'm not looking for a correlation because I don't think they work very well. Even before you made your adjustment for the five years in this study, a .33 correlation is not very meaningful. I would not consider that anywhere near
convincing. Whenever you get a correlation that low, you can usually find five exceptions that created it. To be convincing, a correlation must be very high.
I'm looking for a way to actually falsify the hypotheses. We can
split the league - holding all the other factors equal - and thereby test the various hypotheses. I haven't tried any of this stuff, but the easiest one to check is for quality.
If a higher level of talent quality drives down scoring, then the original six teams should have had lower scoring in the games exclusive to their division than their expansion cousins. This should be a very consistent pattern if the hypothesis is correct. The better half of the league should almost always score less in their games.
Do they? How do you explain it if they don't?
It is harder on the parity side because very good and very bad teams distort the STD so much. That's why I think the last 20 years or so is best. You can toss the top or bottom teams (and their goals of course) and still have
samples big enough to differentiate the conferences.
This should also be very consistent if the (rather, my) hypothesis is correct. In the half of the league where teams are more tightly bunched, scoring should be lower. Is it? If not, the hypothesis is falsified.
# posted by : October 22, 2006 10:43 AM
: October 22, 2006 10:43 AM
I did not attempt to test my belief that low quality of hockey is higher scoring (Klein and Reif convinced me and it has been consistent with almost everything I have seen since their book). There is the problem of the 80's. A high scoring and (presumably) high quality decade. I am not 100% sure how to explain that right now - but I expect it has other explanations aside from the quality of play.
Yes you are correct about several methods that could be used to better test that hypothesis and better test the parity hypothesis (though I am convicned it is false - or at least in need of drastic revision). Someday, I might do so (that vague promise means it wont be today and I havent got things planned out beyond that near time frame).
Yes you are correct about several methods that could be used to better test that hypothesis and better test the parity hypothesis (though I am convicned it is false - or at least in need of drastic revision). Someday, I might do so (that vague promise means it wont be today and I havent got things planned out beyond that near time frame).
I did not attempt to test my belief that low quality of hockey is higher scoring (Klein and Reif convinced me and it has been consistent with almost everything I have seen since their book).
I did not buy this argument at the time. The issue to me was the 50's and 60's. Speaking subjectively, I thought the talent in the league took a big jump in the 1960's. The baby boomers starting to hit the league early in the decade. Scoring went up because Bobby Hull changed shooting and Bobby Orr changed the role of defensemen.
The quality of talent clearly fell in the 1970's but not nearly as much as we thought because expansion was overdue and because the talent pool feeding the league was a lot larger.
Anyway, thanks for the discussion.
# posted by : October 23, 2006 12:12 PM
: October 23, 2006 12:12 PM
This much is true:
1) the highest scoring years in NHL history have been the worst quality years (very first years and WW2)
2) The NHL isa consistently lower scoring than the AHL which is lower scoring than the ECHL.
3) When kids play a pickup game, if ther game lasts as long as an NHL game, typically both teams score a double digit number of goals.
All of that is consistent with the premise that higher scoring hockey is on average lower quality.
Of course many other things can affect scoring rates. Arena size, whether you allow 2 line passes, whether all teams play a trap or not, amount of power play time etc. There isn't any expectation of a 1 to 1 relationship between scoring rates and quality of play but it scales pretty well from the bottom levels right up to the NHL.
Now it could be argued that this breaks down at the very highest levels. When the NHL is at is best, maybe there is no more realtionship between scoring rates and play quality or maybe the relationship changes. I cannot think of a mechanism for this change, but unless one looks for it, it cannot be fully ruled out.
I think that is what you are arguing. I think you are arguing that at some point the scoring rate/ play quality relationship breaks down (and parity enters the picture?).
Although I doubt this scenario, its worth looking at sometime to see if it is consistent with the data. Thats a few problems for another day.
All of that is consistent with the premise that higher scoring hockey is on average lower quality.
It's consistent, but I don't think it is relevant. The talent gap when comparing leagues is too big. Yes, it becomes harder to score as one advances through hockey because the players are bigger, faster, more talented and have been better coached for longer.
The variation in talent in the NHL from year to year or decade to decade is tiny relative to the difference in talent between leagues and levels.
If the local minor hockey league, Atom Division, got a sudden infusion of talent because the Association decided not to have a rep team, would scoring in the league go up or down? I'd guess up, but I don't know. I sure wouldn't be confident it would go down because the talent level was higher. The AHL had a massive infusion of talent in the lockout year. Did scoring go down?
You could be right about parity. The hypothesis is entirely theoretical too. It is based on the idea that when talent is concentrated, production goes up.
I think both ideas are falsifiable and I think they are worthwhile questions for the hockey sabermeticians to investigate. I think we can see two results coming from this CBA. First, the level of talent is down. Second, the talent has been dispersed. Instead of having five classes of teams (sucks, below average, average, above average, elite) we will have three (sucks and elite disappear.)
Ceteris paribus, will either change have an effect on scoring rates? If yes, up or down?
# posted by : October 24, 2006 1:59 AM
: October 24, 2006 1:59 AM
Hi there i am kavin, its my first time to commenting anyplace, when i read this piece of
writing i thought i could also make comment due to this brilliant post.
Also visit my web-site raspberry ketone diet
writing i thought i could also make comment due to this brilliant post.
Also visit my web-site raspberry ketone diet
# posted by : March 23, 2013 3:11 AM
: March 23, 2013 3:11 AM
michael kors outlet, christian louboutin outlet, oakley sunglasses, tiffany and co, nike air max, longchamp outlet, ugg boots, jordan shoes, gucci outlet, uggs on sale, polo ralph lauren outlet, ugg boots, burberry outlet online, nike air max, polo ralph lauren outlet, ray ban sunglasses, ray ban sunglasses, louboutin shoes, michael kors outlet, tiffany jewelry, michael kors, ugg boots, burberry, chanel handbags, oakley sunglasses, louis vuitton outlet, louboutin, prada handbags, longchamp, louboutin outlet, louis vuitton, replica watches, louis vuitton outlet, oakley sunglasses, oakley sunglasses, ugg boots, nike free, michael kors outlet, prada outlet, kate spade outlet, louis vuitton, nike outlet, michael kors outlet, cheap oakley sunglasses, replica watches, ray ban sunglasses
nike air max, north face, true religion jeans, longchamp pas cher, ralph lauren pas cher, mulberry, vans pas cher, hollister, michael kors, timberland, sac longchamp, michael kors, oakley pas cher, hermes, air max, ray ban pas cher, coach factory outlet, hogan, burberry, ralph lauren uk, true religion jeans, air jordan pas cher, michael kors, abercrombie and fitch, nike roshe, lacoste pas cher, north face, air force, tn pas cher, nike air max, nike air max, nike blazer, kate spade handbags, louboutin pas cher, nike free run uk, coach purses, michael kors, lululemon, nike roshe run, converse pas cher, coach outlet, hollister pas cher, true religion jeans, new balance pas cher, coach outlet, vanessa bruno, true religion outlet, ray ban uk, sac guess, nike free
timberland boots, insanity workout, beats by dre, p90x workout, ghd, converse, louboutin, baseball bats, nike trainers, north face outlet, asics running shoes, lululemon, celine handbags, jimmy choo shoes, soccer jerseys, mont blanc, oakley, north face outlet, vans, soccer shoes, nike huarache, giuseppe zanotti, chi flat iron, mcm handbags, nfl jerseys, herve leger, ralph lauren, longchamp, babyliss, valentino shoes, hollister, nike air max, mac cosmetics, abercrombie and fitch, vans shoes, bottega veneta, reebok shoes, iphone 6 cases, hollister, hollister, nike roshe, gucci, new balance, wedding dresses, ray ban, ferragamo shoes, birkin bag, instyler, nike air max, converse outlet
2015-12-17keyun
tiffany jewelry
ugg boots
michael kors outlet clearance
the north face jackets
mulberry uk
canada goose sale
oakley sunglasses cheap
coach clearance
instyler
discount ugg boots
uggs sale
ugg clearance outlet
chanel bags
tory burch outlet online
oakley sunglasses
cheap oakleys
coach outlet store online
ugg boots
christian louboutin
true religion jeans outlet
ugg boots outlet
hollister clothing
burberry sale
cheap air jordans
canada goose
oakley sunglasses sale
louis vuitton outlet stores
louis vuitton purses
giuseppe zanotti outlet
ray ban sunglasses
michael kors outlet online
abercrombie and fitch
michaek kors outlet
kate spade handbags
louis vuitton purses
celine bags
coach outlet store online
christian louboutin shoes
louis vuitton purses
christian louboutin shoes
Post a Comment
tiffany jewelry
ugg boots
michael kors outlet clearance
the north face jackets
mulberry uk
canada goose sale
oakley sunglasses cheap
coach clearance
instyler
discount ugg boots
uggs sale
ugg clearance outlet
chanel bags
tory burch outlet online
oakley sunglasses
cheap oakleys
coach outlet store online
ugg boots
christian louboutin
true religion jeans outlet
ugg boots outlet
hollister clothing
burberry sale
cheap air jordans
canada goose
oakley sunglasses sale
louis vuitton outlet stores
louis vuitton purses
giuseppe zanotti outlet
ray ban sunglasses
michael kors outlet online
abercrombie and fitch
michaek kors outlet
kate spade handbags
louis vuitton purses
celine bags
coach outlet store online
christian louboutin shoes
louis vuitton purses
christian louboutin shoes
<< Home
![]()